Sustainable growth in revenue and profitability
Note: Unless otherwise indicated, changes from the previous year are based on organic figures (adjusted for currency effects, acquisitions / divestitures and deconsolidations).
Sulzer has demonstrated strong resilience and operational excellence in the first half of 2026, delivering solid financial results despite a challenging macroeconomic environment, persistent geopolitical uncertainties and the unresolved situation in the Middle East. Through higher-margin business and continuous improvements in operating efficiency, the company further strongly increased its EBITDA margin by 110 basis points to 15.5% (H1 2025: 14.4%). While customer’s reluctance to make final decisions on larger projects persisted, our aftermarket and base business continued to grow. Overall, this situation led to a slight 3.9% decrease in order intake (H1 2025: -2.4%). Group sales increased by 1.0% compared to a high H1 2025 (6.3%) driven by strong focus on backlog execution. Free cash flow amounted to CHF 12.8 million, representing a decrease of CHF 30.4 million from the first half of 2025 (H1 2025: CHF 43.2 million). This was primarily due to the geopolitically induced build-up of inventories and contract assets resulting from delayed and paused projects.
Resilience in challenging environment, as anticipated few large orders
Business performance in the first half of 2026 was characterized by a challenging macroeconomic environment. The escalating geopolitical situation in the Middle East disrupted trade routes, put supply chains in question and influenced energy prices. This further influenced customers’ final decisions to invest in new larger projects while our aftermarket and base business continued to grow, resulting in a slight order intake decrease of 3.9% to CHF 1’786.6 million compared with the same period in 2025. Order intake would have been CHF 1’888.7 million, excluding impact from currency conversion. The order intake gross margin decreased by 60 basis points, reaching 35.7%.
Orders
|
millions of CHF |
|
2026 |
|
2025 |
|
Change in +/– |
|
+/–% organic 1) |
|
Order intake |
|
1’786.6 |
|
1’961.4 |
|
–174.8 |
|
–3.9 |
|
Order intake gross margin |
|
35.7% |
|
36.3% |
|
–0.6 |
|
|
|
Order backlog as of June 30 / December 31 |
|
2’396.5 |
|
2’255.6 |
|
140.9 |
|
|
1) Adjusted for acquisition, divestiture / deconsolidation and currency effects.
In the Flow division order intake increased by 1.4%, mainly driven by the solid base business in Energy and Infrastructure by 9.8%. The Water and Industrial business reported a slight decrease of 3.8%. Order intake in the Services division grew by 0.2% year-on-year despite a high comparison including two exceptionally large orders in addition to a very strong base business in H1 2025 (12.0%) and customers deferring service cycles in response to high energy prices. Chemtech’s order intake decreased by 22.7% (H1 2025: -21.5%)1 due to delayed customer investment decisions for new technologies (biopolymers, Carbon Capture or Sustainable Aviation Fuels), whereas the core business remained stable.
Sulzer enters the second half of 2026 with a solid order backlog of CHF 2’396.5 million (December 31, 2025: CHF 2’255.6 million). Excluding the impact of currency conversion, the order backlog would have been CHF 2’363.9 million.
![graphic]()
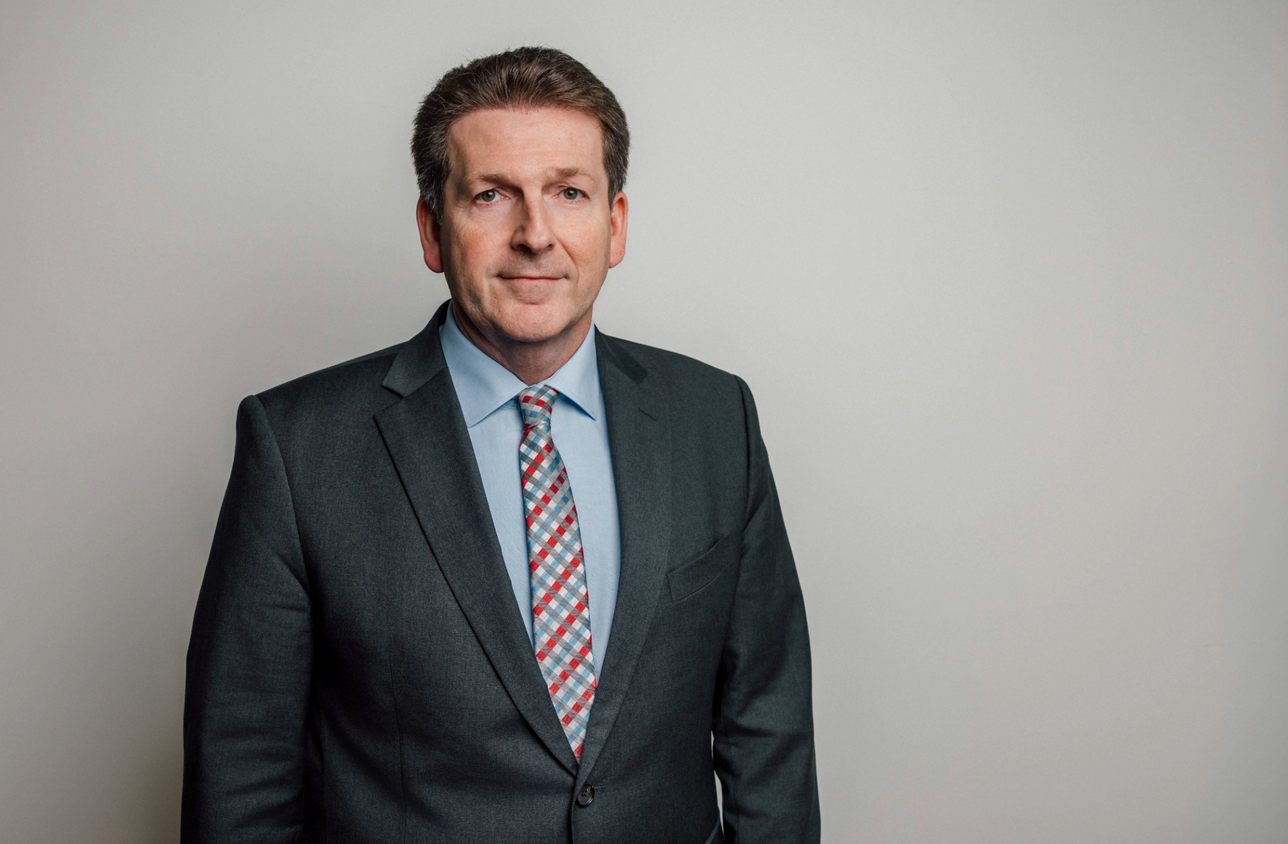
Driven by our resilient base business and expanding aftermarket activities, we again delivered stronger profitability, which demonstrates that our Excellence machine is working. Based on our visibility of a full but very backend-loaded project pipeline for the second half of 2026, we confirm our outlook.”
Thomas Zickler Chief Financial Officer
Disciplined backlog execution resulted in H1 2026 sales of CHF 1’672.6 million, a 1.0% year-on-year increase. Excluding the currency conversion impact, sales would have been CHF 1’765.4 million.
The reported sales growth was mainly driven by continued focus on operational excellence and execution in the Services division resulting in an increase of 4.4% compared to a strong H1 2025 (14.8%), with the Americas and Europe, Middle East and Africa regions leading the momentum. In the Flow division, global sales grew by 0.5% (H1 2025: 10.7%)1, anchored by steady infrastructure investments. This includes a 0.2% increase in Energy and Infrastructure, alongside a 1.3% rise in the Water and Industrial segments. Conversely, Chemtech revenue reduced by 4.9% (H1 2025: -15.1%)1 reflecting a reprioritization of new technology projects involving biopolymers, Carbon Capture or Sustainable Aviation Fuels.
Continued strong margin and profit growth
In the first half of 2026, the gross profit margin increased by 130 basis points to 34.9% (H1 2025: 33.6%), driven by a higher share of high margin business coupled with continued measures to improve operational excellence. Gross profit totaled CHF 583.2 million, representing a year-on-year increase of 4.4% for the first half of 2026. Excluding the currency conversion impact, gross profit would have been CHF 612.2 million.
1) The comparative figures for 2025 have been restated and aligned to reflect the focus on Water Treatment expertise in 2026. The “FRC” business, formerly included under “System Solutions” in the Chemtech division has been transferred to the Flow division and is now reported under “Water and Industrial”.
EBITDA margin growth to 15.5%
For the half-year ending 30 June 2026, EBITDA amounted to CHF 258.7 million compared with CHF 251.0 million for the same period in 2025. The EBITDA margin increased by 110 basis points year-on-year to 15.5% (H1 2025: 14.4%), reflecting stronger gross margin performance coupled with continuous improvements in Sulzer’s commercial and operational excellence.
EBITDA margin (January 1 – June 30)
|
millions of CHF |
|
2026 |
|
2025 |
|
+/–% organic 1) |
|
EBITDA |
|
258.7 |
|
251.0 |
|
9.7 |
|
Sales |
|
1’672.6 |
|
1’743.9 |
|
1.0 |
|
EBITDA margin |
|
15.5% |
|
14.4% |
|
|
1) Adjusted for acquisition, divestiture / deconsolidation and currency effects.
EBITDA margin in the Flow division strongly increased from 12.3% in the first half of 20251 to 13.3% up 100 basis points in a year-on-year comparison, benefitting from higher gross margins and the continued execution of excellence initiatives, allowing for additional spent in the commercial organization. In the Services division, EBITDA margin reached a notable 17.7%, up 100 basis points, in a year-on-year comparison amid ongoing strategic investments to support growth initiatives. Despite lower sales, Chemtech reported a stable EBITDA margin of 11.7% as a result of continued execution of Sulzer excellence and cost measures which were implemented in H2 2025.
Bridge from EBITDA to EBIT (January 1 – June 30)
|
millions of CHF |
|
2026 |
|
2025 |
|
Change in +/– |
|
EBITDA |
|
258.7 |
|
251.0 |
|
7.7 |
|
Amortization |
|
–19.6 |
|
–20.3 |
|
0.7 |
|
Depreciation |
|
–39.9 |
|
–38.0 |
|
–2.0 |
|
EBIT |
|
199.1 |
|
192.7 |
|
6.4 |
Financial result
As of June 30, 2026, total net financial expenses reached CHF 20.7 million, compared with CHF 14.5 million reported for the same period in 2025. Net interest expenses increased to CHF 10.8 million, compared with CHF 7.2 million in the first half of 2025, primarily due to a decline in interest income on cash and cash equivalents. Fair value changes, mainly associated with hedging instruments, contributed to a negative effect of CHF 9.3 million (H1 2025: gains of CHF 0.5 million). Net currency exchange losses were CHF 1.7 million, compared with net currency losses of CHF 7.7 million reported in the first half of the previous year.
1) The comparative figures for 2025 have been restated and aligned to reflect the focus on Water Treatment expertise in 2026. The “FRC” business, formerly included under “System Solutions” in the Chemtech division has been transferred to the Flow division and is now reported under “Water and Industrial”.
Effective tax rate at 22.0%
As of June 30, 2026, the estimated average annual tax rate is projected at 22.0%, below the 24.2% reported on June 30, 2025. In the first half of 2026 income tax expenses totaled CHF 39.1 million compared with CHF 40.9 million for the corresponding period in 2025.
Strong net income and core net income growth
Net income amounted to CHF 138.8 million in the first half of 2026 compared with CHF 128.2 million in the same period of 2025. Core net income, which excludes restructuring expenses, amortization, impairments, non-operational items and the tax-adjusted effects of such items, totaled CHF 159.6 million for the first half of 2026, above the CHF 143.6 million reported in the first half of 2025. Basic earnings per share increased to CHF 4.07 for the six-month period ended June 30, 2026, from CHF 3.77 in the prior-year period, reflecting higher net income.
Bridge from net income to core net income
|
millions of CHF |
|
2026 |
|
2025 |
|
Change in +/– |
|
Net income |
|
138.8 |
|
128.2 |
|
10.5 |
|
Amortization |
|
19.6 |
|
20.3 |
|
–0.7 |
|
Restructuring expenses |
|
6.1 |
|
3.8 |
|
2.3 |
|
Non-operational items 1) |
|
0.5 |
|
–3.7 |
|
4.2 |
|
Tax impact on above items |
|
–5.4 |
|
–5.0 |
|
–0.4 |
|
Core net income |
|
159.6 |
|
143.6 |
|
16.0 |
1) Non-operational items include significant acquisition related expenses, gains and losses from the sale or closure of businesses and certain non-operational items that are non-recurring or do not regularly occur in similar magnitude.
Key balance sheet positions
Unless otherwise indicated, balance sheet movements from the previous year are based on nominal figures.
Total assets as of June 30, 2026, amounted to CHF 4’722.9 million, an increase of CHF 160.0 million compared with December 31, 2025.
Non-current assets rose by CHF 32.4 million to CHF 1’707.5 million. This growth was primarily driven by a CHF 38.9 million increase in property, plant and equipment and lease assets, alongside a CHF 16.8 million increase in defined benefit assets, partly offset by CHF -18.7 million in other intangible assets.
Current assets increased by CHF 127.6 million to CHF 3’015.4 million. Key drivers were the project-related increase in inventories (CHF 70.5 million) and higher contract assets (CHF 95.0 million). In addition, total cash and cash equivalents decreased to CHF 843.2 million (CHF 927.3 million in December 2025), mainly due to higher net working capital requirements.
Total liabilities increased by CHF 139.5 million to CHF 3’397.0 million as of June 30, 2026. The main reason was the increase of CHF 88.0 million in other current and accrued liabilities. Trade accounts payable decreased by CHF 4.8 million, and current income tax liabilities increased by CHF 14.7 million.
Equity increased by CHF 20.4 million to CHF 1’325.8 million. This was mainly driven by higher net income of CHF 138.8 million coupled with CHF 16.5 million from positive currency translation, offset by dividend distributions (CHF 161.2 million).
Free cash flow
Free cash flow, for the first half of the year, amounted to CHF 12.8 million (H1 2025: CHF 43.2 million), impacted by geopolitically induced build-up of inventories and contract assets resulting from delayed and paused projects.
Bridge from cash flow from operating activities to free cash flow
|
millions of CHF |
|
2026 |
|
2025 |
|
Change in +/– |
|
Cash flow from operating activities |
|
57.0 |
|
79.7 |
|
–22.6 |
|
Purchase of intangible assets |
|
–0.2 |
|
–0.9 |
|
0.8 |
|
Proceeds from the sale of intangible assets |
|
0.0 |
|
0.1 |
|
–0.1 |
|
Purchase of property, plant and equipment |
|
–44.8 |
|
–38.2 |
|
–6.6 |
|
Proceeds from the sale of property, plant and equipment |
|
0.8 |
|
2.6 |
|
–1.9 |
|
Free cash flow (FCF) |
|
12.8 |
|
43.2 |
|
–30.4 |
Cash outflows from investing activities rose to CHF 47.5 million in the first half of 2026, up from CHF 40.6 million in the prior-year period. This capital allocation was predominantly driven by a CHF 44.8 million investment in the purchase of property, plant and equipment.
In the first six months of 2026, cash outflows from financing activities decreased to CHF 105.4 million, down from CHF 135.8 million in the previous year. The net change in cash and cash equivalents since January 1, 2026, was CHF -84.2 million, which includes a positive foreign exchange impact of CHF 11.6 million.
Outlook for 2026
As expected and communicated at the end of February with our full year results, we have seen a slower first half of the year 2026. We confirm our outlook for a backend-loaded 2026 with a year-on-year organic order intake growth of 1% to 5%, a year-on-year sales growth between 2% and 5% and an EBITDA margin of around 16.5%.
Abbreviations
EBIT: Earnings before interest and taxes
EBITDA: Earnings before interest, taxes, depreciation, amortization and impairment.
FCF: Free cash flow
For the definitions of the alternative performance measures, please refer to “Supplementary information” in the Annual Report 2025.